Oscilloscope & Spectrogram 1.0.3
Paid Version
Publisher Description
OSCILLOSCOPE & SPECTROGRAM is a powerful audio analyzer app and audio unit plugin
KEY FEATURES
- Run as both Audio Unit and standalone app
- View up to three seconds of audio on the screen
- Pause and scroll horizontally to browse back in time
- Pinch to zoom in / zoom out
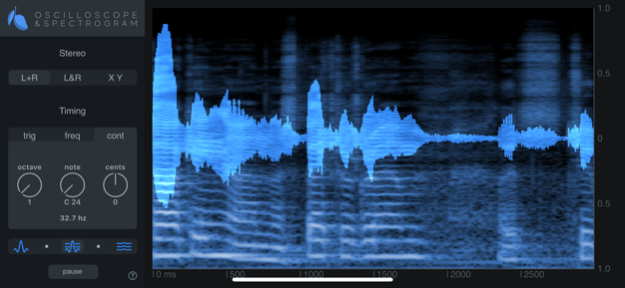
- See both oscilloscope and spectrogram separately or overlayed together
- Frequency trigger mode helps identify the precise frequency and MIDI note of sounds in the spectrogram
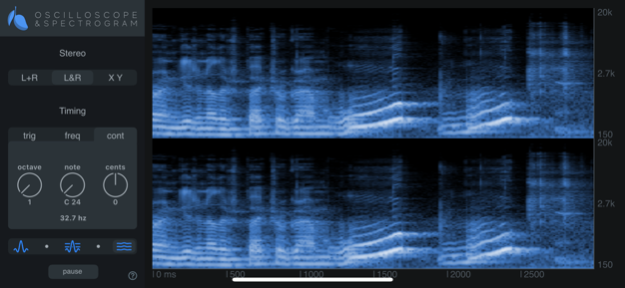
- Stereo and mono views
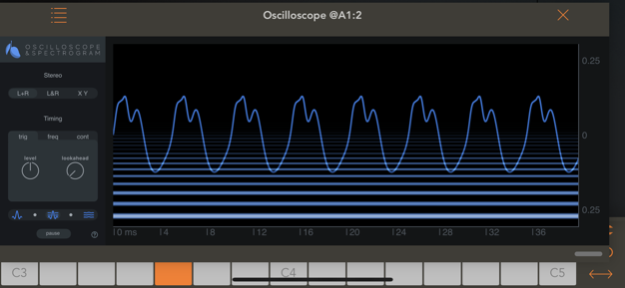
- Level based trigger mode has lookahead, pause, and zoom
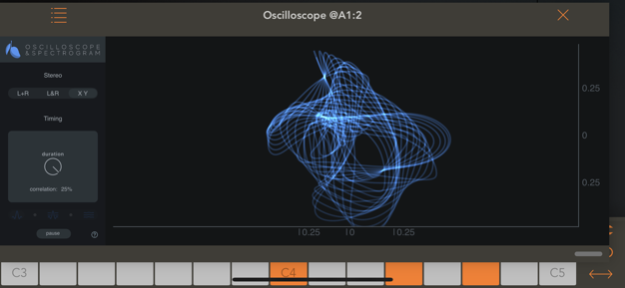
- XY mode shows stereo correlation
- Automatically adjusts FFT size to fit zoom setting
- Bark-frequency scale spectrogram shows nice detail at low and high frequencies
- When zoomed in, the oscilloscope uses sinc upsampling to show you a close approximation of what actually outputs from your audio interface after digital to analog conversion, rather than just displaying raw audio samples.
WHAT DOES THIS APP DO THAT OTHERS DO NOT?
1. Pause Button
We can't emphasize enough how useful this is. You never have to worry about trying to catch short events that disappear quickly because you can watch the sounds go by slowly at a 3 second viewer scale, then just pause and scroll back if you missed something. When you get to the event you want to see you can pinch to zoom in right down to sub-sample level of detail, then zoom back out when you are done and zoom in on something else. This feature alone makes almost all other oscilloscope apps unnecessary because it means you can easily see ANYTHING that you need to see.
2. Frequency Identification Mode
In frequency mode, when you touch the frequency scale on the right of the screen a blue line appears on the spectrogram. When you position the line above a specific frequency on the spectrogram, a panel on the left side of the screen displays the octave, note name, and MIDI number. You can then use the frequency timing oscilloscope to lock in on the exact pitch in cents so that you not only know which MIDI note that sound corresponds to but you know exactly how many cents sharp or flat. The ability to simultaneously see the frequency on the spectrogram and confirm it with precision on the oscilloscope allows you to quickly and easily identify musical pitches to a level of accuracy that have not seen anywhere else, not even in desktop software.
3. Trigger with Lookahead
Almost every oscilloscope has a feature where it re-draws the screen each time the input signal level crosses a specified threshold. This is the main and most basic function of any oscilloscope. However, when setting the trigger at a high level to view the attack section of musical notes or drums, we miss the first part of the note. By using lookahead, this app allows you to see a few milliseconds BEFORE the trigger point so that you can see the whole sound you want to examine.
4. Carefully Designed Spectrogram
In all spectrum analyzer displays, the upper end of the frequency scale is crowded, meaning that a single pixel corresponds to 10 or 20 frequencies in the frequency analysis. In many other analyzer apps one of two things occur: either 9 out of 10 frequencies in that upper range simply get ignored and disappear from the spectrogram display, or all 10 frequencies combine together to make the pixels in the upper range appear brighter than low frequency sounds of similar volume. This may seem like a technicality until you run a sine sweep or a 20 KHz tone through the analyzer and find that large sections of the input simply aren't displayed on the analyzer screen. Looking at these kinds of test signals on a spectrogram is the primary way that we test and evaluate the quality of audio effect plugins. If a spectrogram is to be of any real use as an analysis tool, it should do this right. Other spectrograms often mess up the lower frequencies too, either by making them take up too much space or by making them very pixelated. This spectrogram carefully avoids these problems.
Sep 4, 2020
Version 1.0.3
Updated spectrogram to eliminate visual discontinuities when viewing sine sweeps.
About Oscilloscope & Spectrogram
Oscilloscope & Spectrogram is a paid app for iOS published in the Audio File Players list of apps, part of Audio & Multimedia.
The company that develops Oscilloscope & Spectrogram is Mani Consulting Limited Company. The latest version released by its developer is 1.0.3.
To install Oscilloscope & Spectrogram on your iOS device, just click the green Continue To App button above to start the installation process. The app is listed on our website since 2020-09-04 and was downloaded 20 times. We have already checked if the download link is safe, however for your own protection we recommend that you scan the downloaded app with your antivirus. Your antivirus may detect the Oscilloscope & Spectrogram as malware if the download link is broken.
How to install Oscilloscope & Spectrogram on your iOS device:
- Click on the Continue To App button on our website. This will redirect you to the App Store.
- Once the Oscilloscope & Spectrogram is shown in the iTunes listing of your iOS device, you can start its download and installation. Tap on the GET button to the right of the app to start downloading it.
- If you are not logged-in the iOS appstore app, you'll be prompted for your your Apple ID and/or password.
- After Oscilloscope & Spectrogram is downloaded, you'll see an INSTALL button to the right. Tap on it to start the actual installation of the iOS app.
- Once installation is finished you can tap on the OPEN button to start it. Its icon will also be added to your device home screen.
